BLOG
Debugging is a big part of our time as developers, and it is a skill like any other that when improved can make our workflow better and make us more efficient. That is why today I will be exploring some of the debugging functionalities that are available in IntelliJ, the IDE of my choice, and I will be taking you with me.
Method breakpoints
Apart from ordinary line breakpoints, we can set method breakpoints too, by placing the breakpoint at the line where the method is declared:
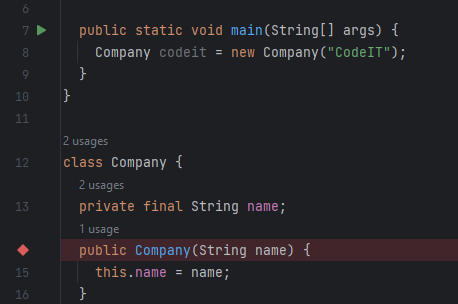
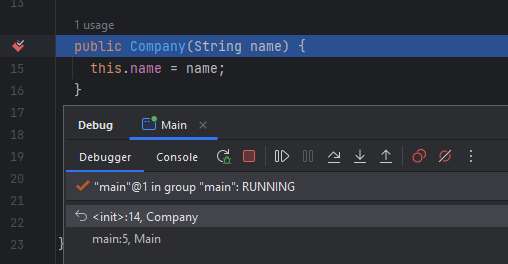
IntelliJ lets us know that this is a method breakpoint by showing a diamond-like icon rather than the classic circle. This breakpoint will suspend the program every time the method is called, and we can view who called it from the stack trace:
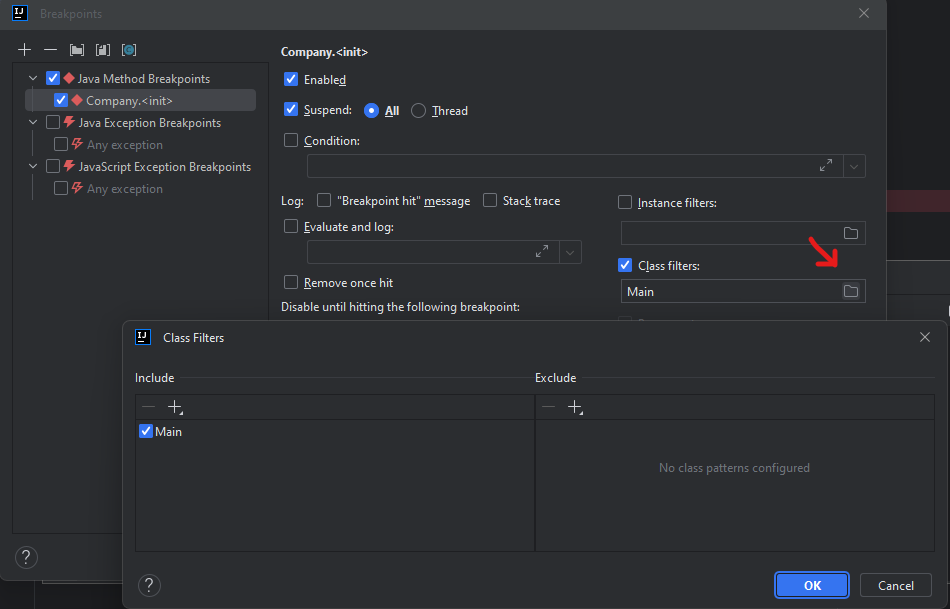
By pressing Ctrl+Shift+F8 we can open the Breakpoints window where we can see all breakpoints that we have set and define some additional options, such as filtering out some classes so that the program is not suspended if the method was called by them:
Exception breakpoints
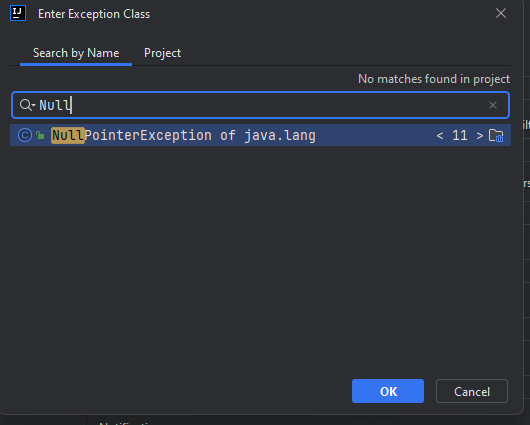
From the Breakpoints window we can set another type of breakpoint - exception breakpoints. We do so by clicking the “+” button on the top left corner of the window and choosing “Java Exception Breakpoints”. We can then choose the type of exception or search it in the search field:
After it’s added, it will be placed and activated wherever that type of exception is thrown (if ever):
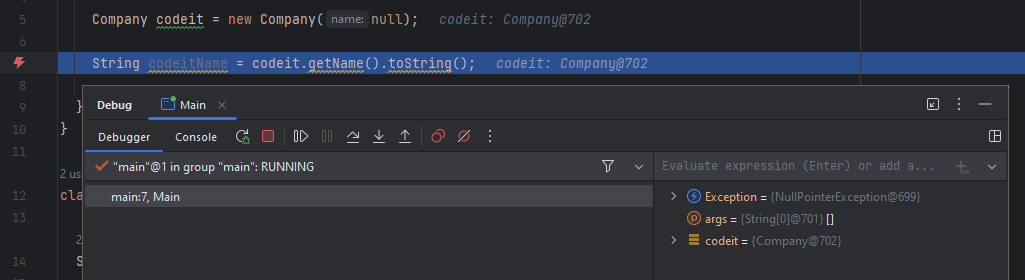
We can see by the different icons that it’s an exceptional breakpoint.
Breakpoint condition
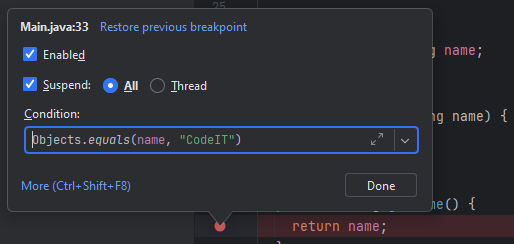
Another useful feature is the ability to set conditions to breakpoints. This is useful if, for example, a method is called many times but we only need to debug one condition. Let’s say the `getName()` method is called many times, but we only want to debug when the name is “CodeIT”, skipping everything else and saving us time. We can quickly do this by right-clicking on the breakpoint and setting our condition there:
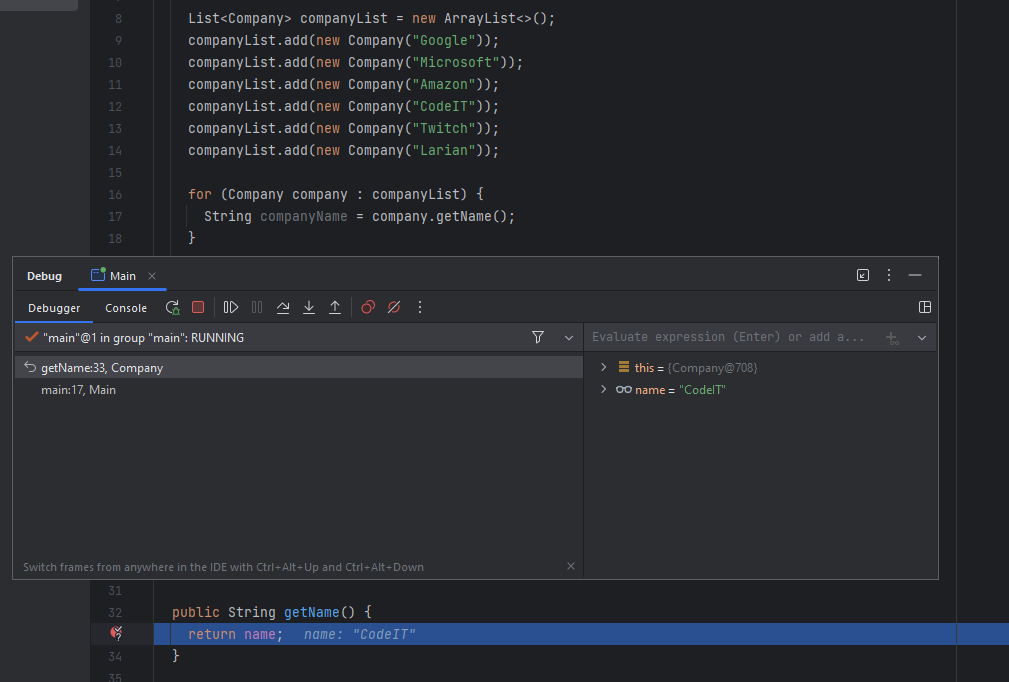
The breakpoint is only activated when the company is Codeit, despite the method being called before as well.
Debugging streams
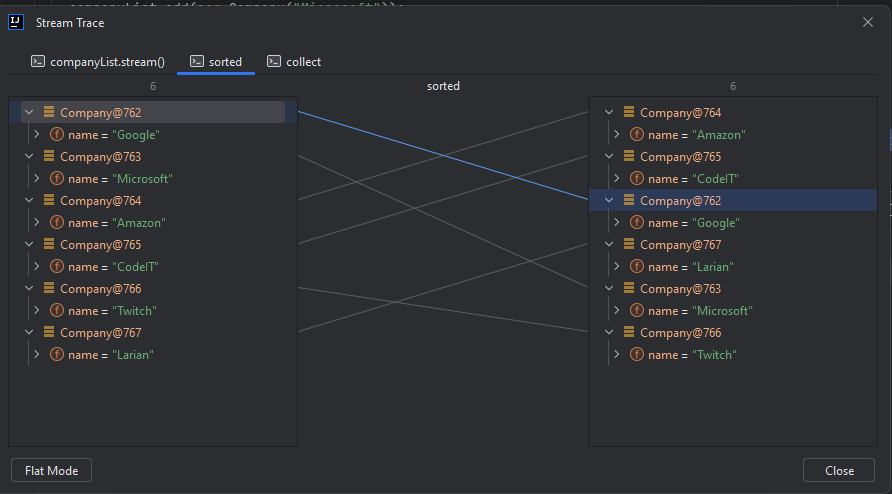
Another useful feature in IntelliJ are the stream debugging tools.Let’s say we’re doing some operations on a stream and we want to debug them:
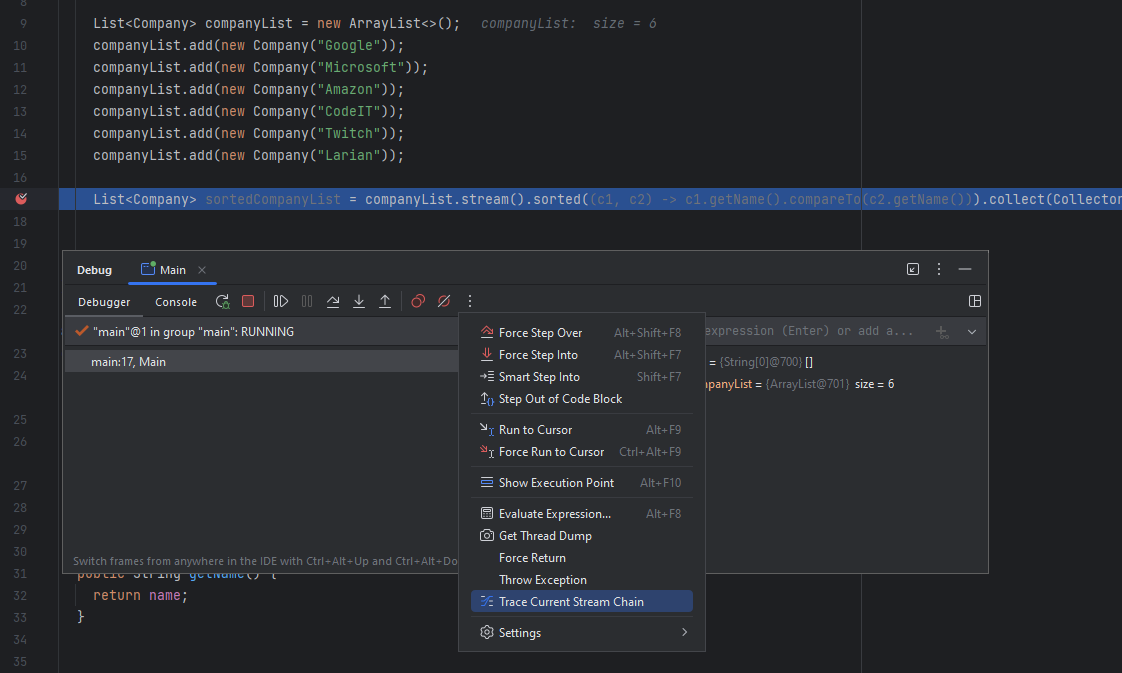
By clicking on the three dots and selecting the “Trace Current Stream Chain” option, we are able to visualize each operation a little easier:
Conclusion
Debugging is something we all do as developers, so we might as well use the modern tools to our advantage to make it as pain-free as possible. Hopefully some of these tips were as useful to someone as they were to me.