BLOG
What is Grafana k6?
Grafana k6 is a developer-centric load testing tool that turns "will this survive traffic?" from a guess into a measurable answer.
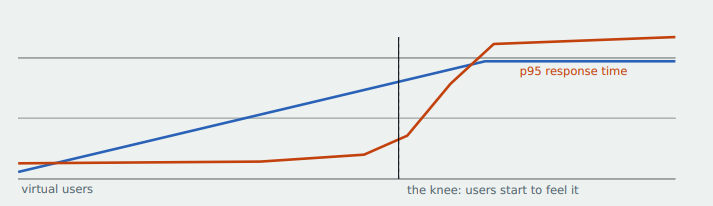
Instead of wondering how your site behaves under pressure, you write a script, run it, and get hard numbers back, such as response times, error rates, and exactly where things start to break. From a quick smoke test on a staging site to a full production stress test, k6 makes performance testing something you can script, automate, and repeat, instead of something you do once and hope for the best.
The Core of k6
The features that make k6 a favorite for developers range from JavaScript-native scripting to built-in performance thresholds and native Grafana integration. Each one is designed to make load testing feel like part of your normal workflow, not a separate ordeal.
1. Tests Written in Plain JavaScript
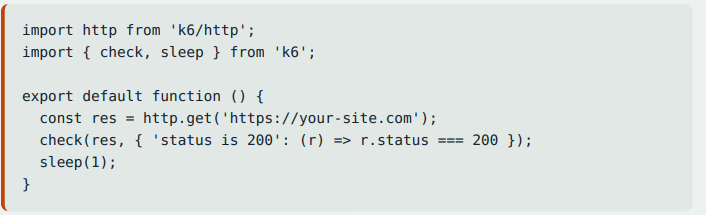
No proprietary syntax, no drag-and-drop test builder. If you already know JS, you already know most of k6.
2. Virtual Users, Not Guesswork
k6 simulates load using virtual users (VUs): simulated visitors running your script in a loop. You control exactly how many, how fast they ramp up, and how long they stay. So instead of vaguely "testing performance," you're answering a specific question: what happens at 50 concurrent users? At 500? Where does it start to bend?
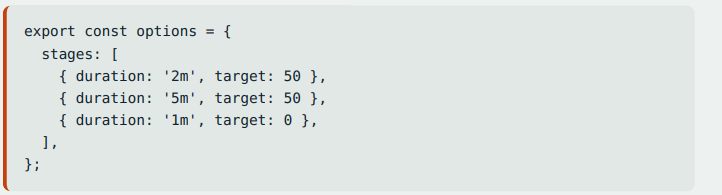
Ramp up, hold steady, ramp down. This is the shape of a test that mirrors the shape of real traffic.
3. Thresholds That Turn Tests Into Gates
This is where k6 stops being just a script and starts being a safety net. A threshold is a pass/fail rule for the whole run. It is set on response time or error rate, and if it's broken, k6 exits with a non-zero status code.

That exit code is what makes k6 slot straight into a CI pipeline. A pull request can run a quick load test automatically, and if performance regresses, the build fails. No manual checking required.
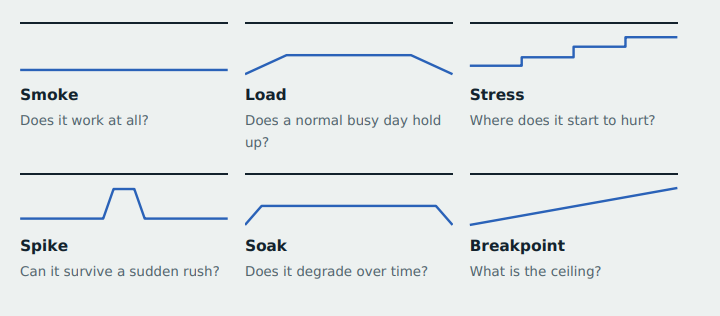
4. Six Ways to Shape a Test
k6 doesn't force one kind of load onto every test. Each shape answers a different question, so picking the right one means you're testing what you actually want to know, not just throwing users at a URL and hoping something interesting happens.
5. Native Grafana Integration
Since k6 is built by Grafana Labs, plugging results into a Grafana dashboard is the way to go, and it's super simple. Stream metrics straight to Prometheus and watch virtual users, latency, and error rate update live on a dashboard as the test runs.
k6 run -o experimental-prometheus-rw script.js
This turns a wall of terminal output into something you can actually read and, just as importantly, something you can look back at later and compare between runs.
Rule of thumb: only load test systems you own or have written permission to test. To the target, a load test looks exactly like a denial-of-service attack.
Example of a k6 Script
This script pulls together everything above into one working file. It runs 5 virtual users for 30 seconds, sets thresholds for both request duration and failure rate, and adds a short sleep between iterations.
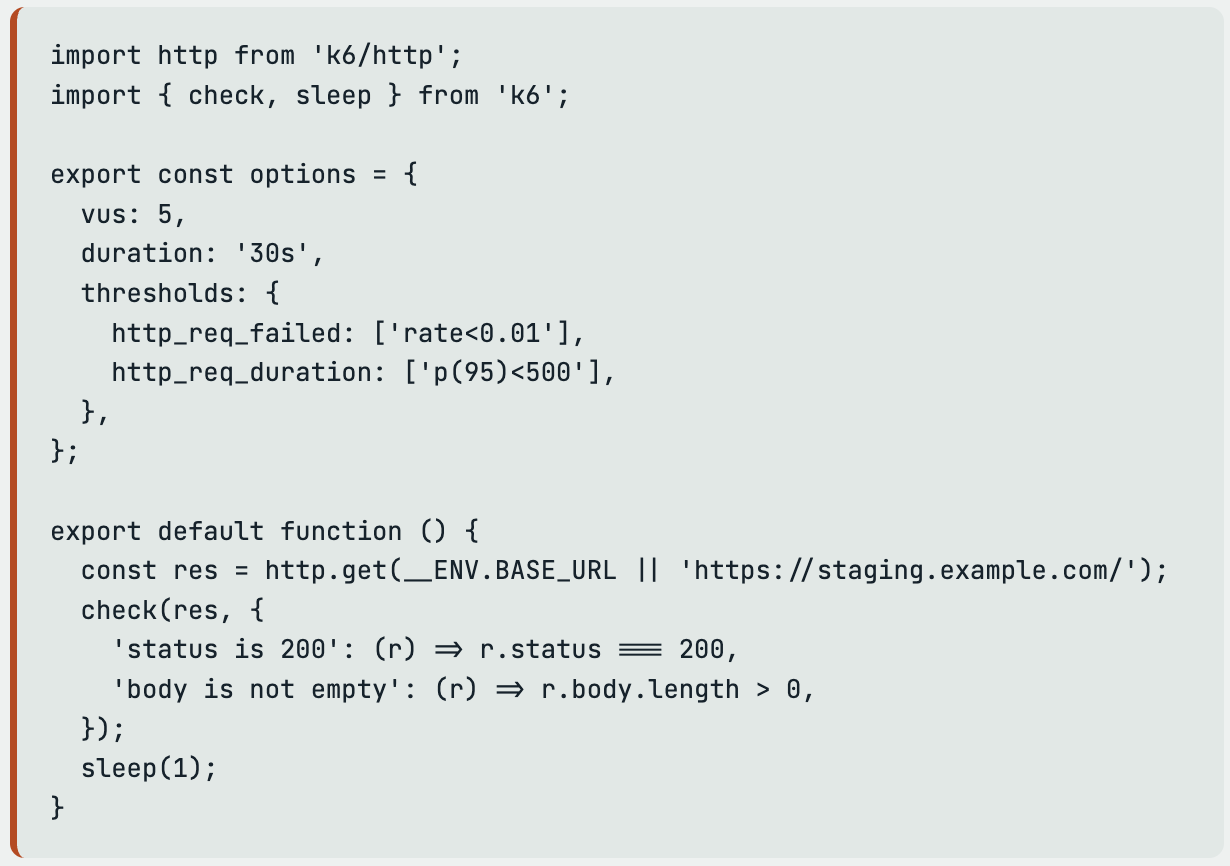
To run the script, use k6 run script.js and check your results. Which brings us to the next important thing: how to read them.
Reading the Results
The proper way to read results is in percentiles, not averages. For example, say you have 100 requests: 90 of them take 200 ms and 10 take 3 seconds.
The average is 480 ms, which looks fine. But the p95 is 3 s, meaning one user in ten waits three seconds, something an average would never show you.
A k6 run reports several metrics. Here is what the main ones mean:
http_req_duration: p95 and p99 latency
http_req_failed: share of failed requests
http_reqs: throughput, requests per second
vus: how many virtual users were active
To explore more about k6, visit k6.io.