BLOG
Just dipped your toes into the vast ocean of software development?
Feeling like you're swimming in code, chasing bugs for what seems like an eternity? Don't worry, we've all been there!
I will try to save you time and keep your nerves intact on your journey to mastering the craft of debugging.
For those wondering, debugging is the process of finding and resolving bugs in the code, basically a detective work for code.
But let's be real, debugging ain't no walk in the park. It's one of the toughest challenges us software devs face.
Though it might get frustrating at first, mastering the debugger is crucial to your growth as a developer.This is a skill you’ll learn in the beginning of your career, and if you’re lucky it can be from your colleagues and if not I got you!
Now let’s go through everything you need to know to crush those bugs!
Ladies and gentlemen I present you....
My daily debugging "to do list" or in this case your debugging guide!
Let's start easy:
Decode the puzzle
Every bug hunt starts with a crucial question: where's the glitch hiding?
Is it a front end bug or back end problem?
Is it a request/response problem or is something in the components/backend?
So buckle up, we are only at the first step to solving the problem, but knowing this is a great start!
Bug Reproduction: Get local and get It right!
Once you know what you’ve got to do be sure to reproduce it locally.
But here's the kicker: always test in incognito mode or flip that cache switch in your browser's dev tools. Trust me, skipping this step is a rookie move you'll regret!
Browser Dev Tools: Your secret weapon!
Say hello to your best friend in debugging: Browser Developer Tools, Aveilable in Google Chrome, Firefox, Edge and Safari.
They offer a suite of tools that helps us analyze web pages, diagnose problems, and optimize performance.
For debugging they mostly help us identify DTOs and front end bugs.
Dive into HTML and CSS: Or the Inspector's playbook
Ready to get your hands dirty with HTML and CSS?
You can right-click on any element on a webpage and select "Inspect" to open the Developer Tools and see the HTML markup and CSS styles applied to that element. This is invaluable for identifying layout issues, debugging styling problems, and understanding the structure of a webpage.
You can put styles directly into element.style {} of the selected element or turn off/on styles that are being loaded for that element.
This is useful to make new styles directly (without type than save and refresh) or identify and fix broken css.
This tool is your ticket to web dev nirvana.
Don’t forget to copy paste that into your code later.
 Console
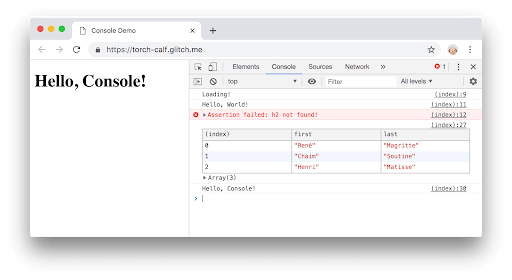
The Console tab in Developer Tools is used to catch front end errors.
Console logging is a common practice for debugging JavaScript code, allowing you to see variable values, trace the flow of execution, and identify errors.
Whether you're keeping tabs on variables during different events or making sure your functions are getting called, console logging is your go-to move for smoother front-end development. It's like having a detective's magnifying glass for your code!
.png)
Network Analysis
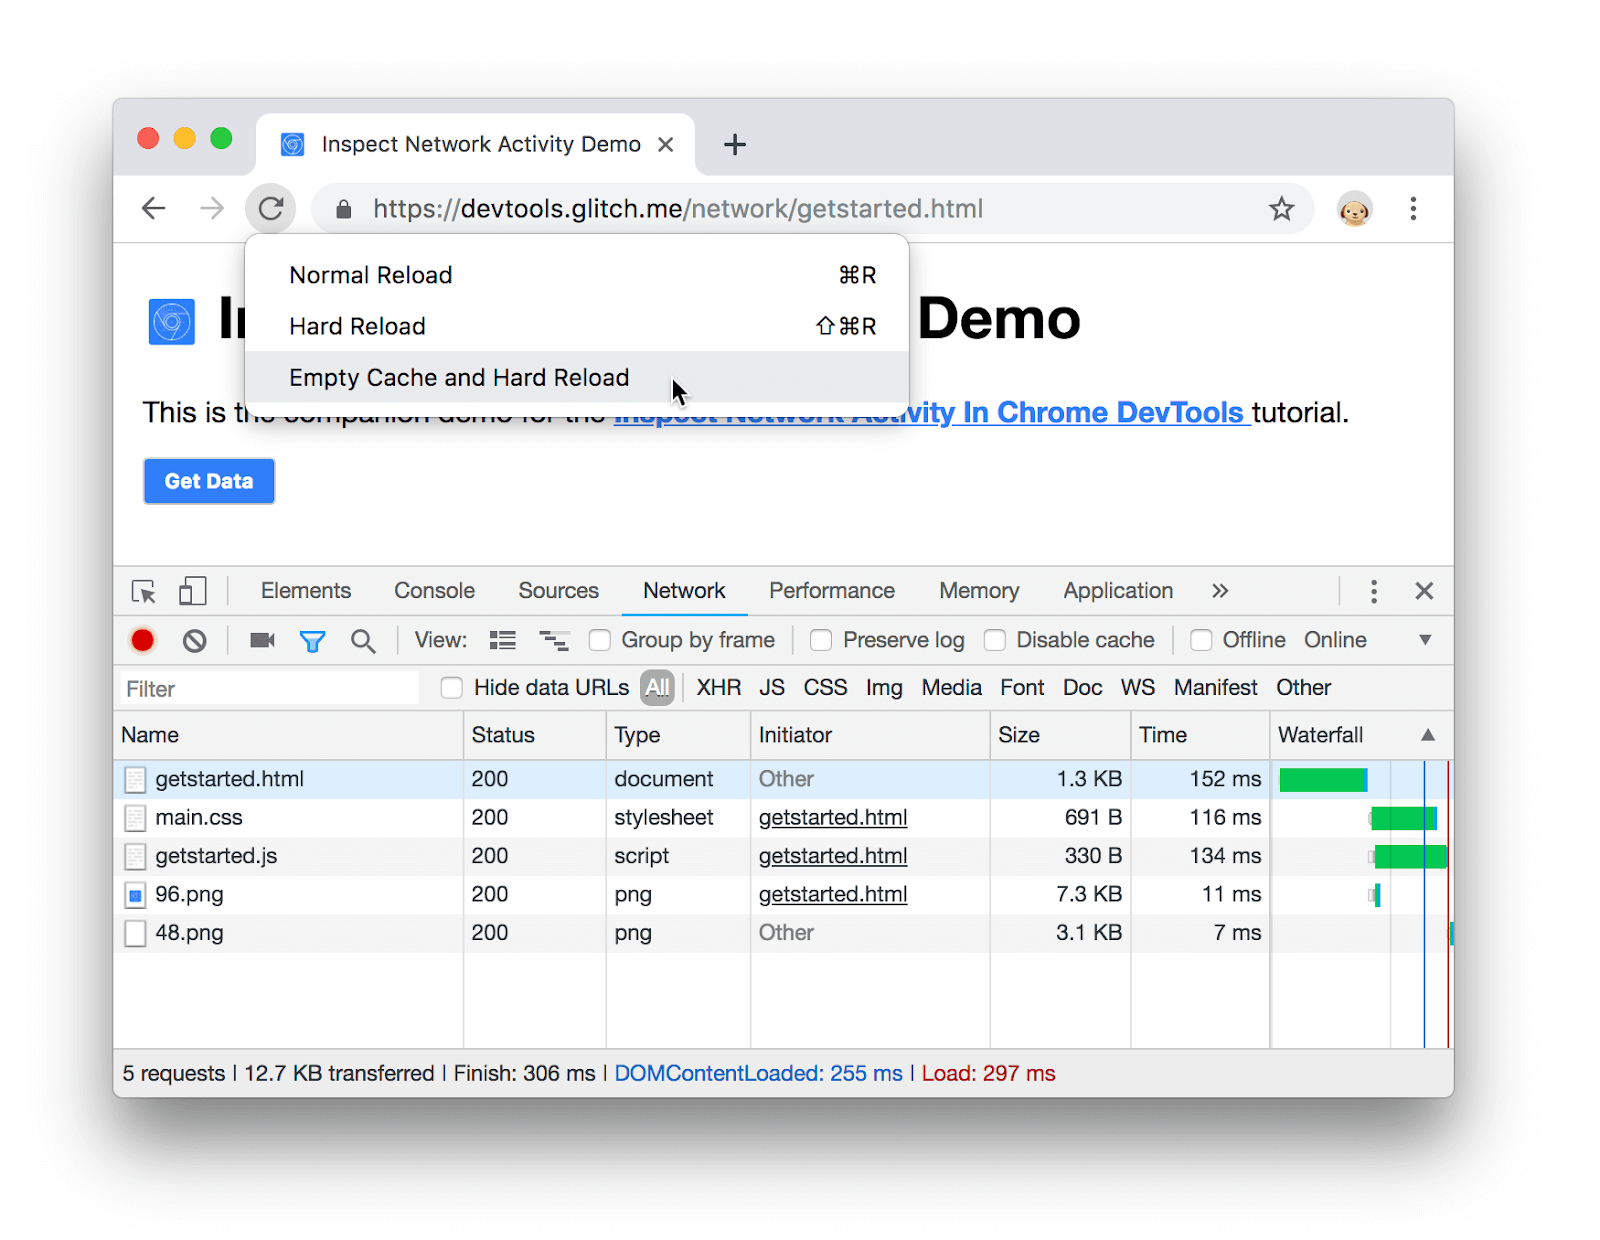
If we open the network tab and refresh the page we can see all the requests that are being pushed to the network. In the payload we can see all the parameters that are being sent. In the response tab we can see the response that the server has been given to that request.
Why is this cool? Well, when stuff goes sideways, you can tell if it's a front-end fumble or a back-end boo-boo. It's like having X-ray vision for your website glitches.
.png)
IDE Debuggers Decoded
Debugging with IDE (Integrated Development Environment) debuggers offers a powerful and efficient way to identify and resolve issues in your code.
We have a problem that occurs on the backend?
No problem. Just copy the path from the network in the headers tab, and search for it in your backend app.
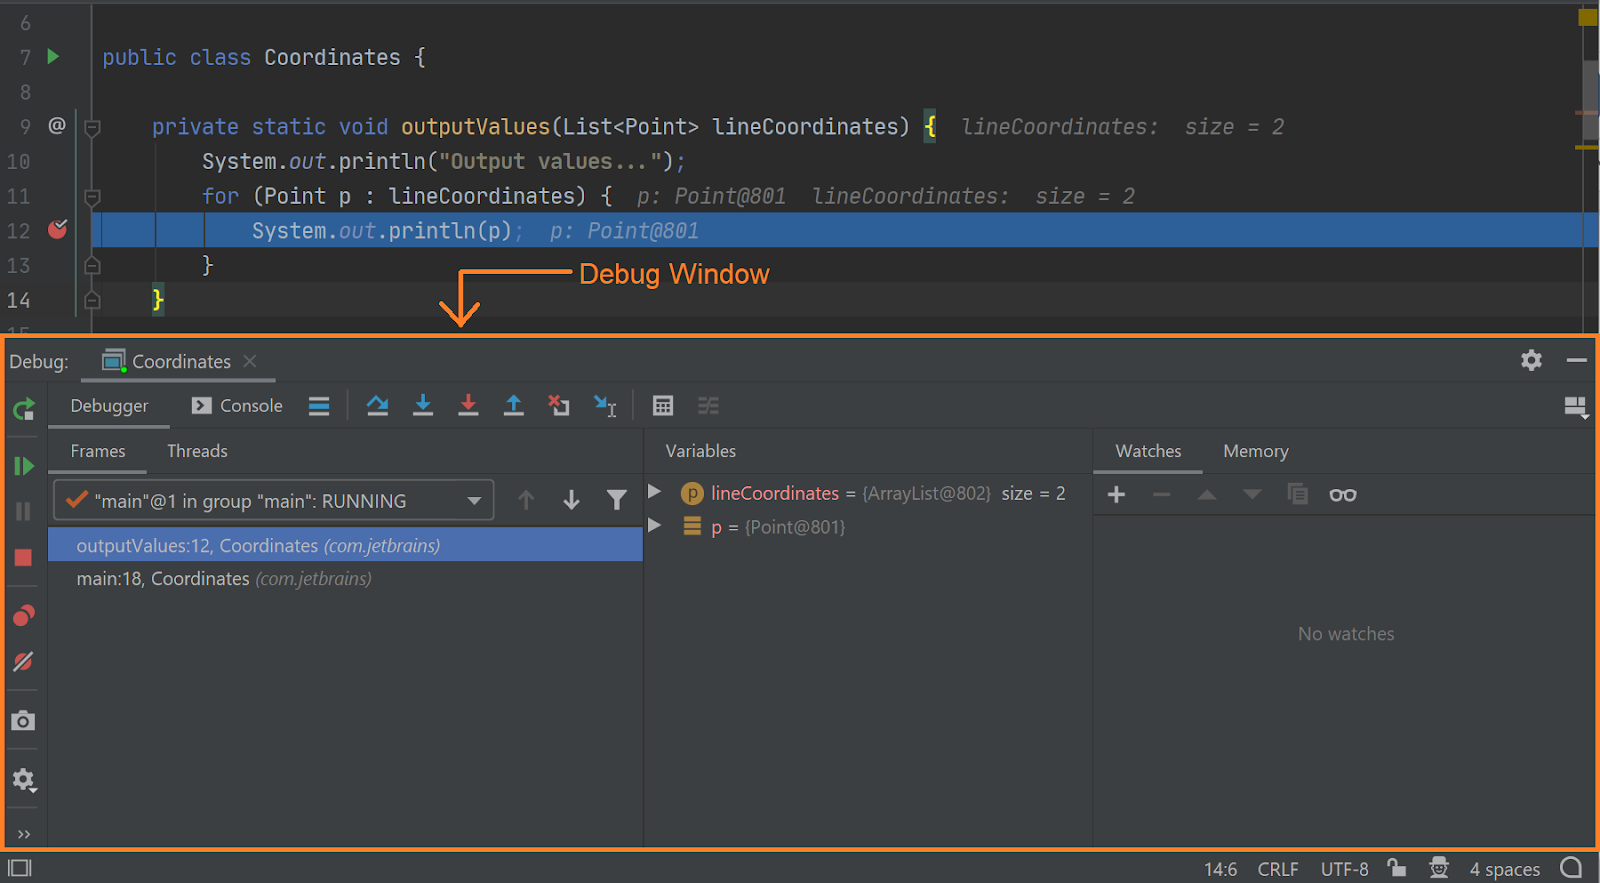
Once you find one or more functions with that specific path, just start the project in debugging mode and place a breakpoint on a line within that function.
Refresh and watch the magic unfold as you step through your code, unraveling the mystery one line at a time, but still keep an open eye.
While debugging, you can inspect the values of variables at any point in your code. IDE debuggers provide a variety of ways to view and interact with variables, including hovering over variables to see their current values, adding variables to a watch list for monitoring, and examining variables in a dedicated "Variables" or "Watches" panel. You can also evaluate expressions in debugging mode.
This is useful when you have some idea for a solution, or you wanna try something on that line, so you don’t have to type it and restart the application for every attempt.
.png)
Chrome THE Debugger
Do we have a problem on the front end in some specific complex function?
You can debug in Chrome too.
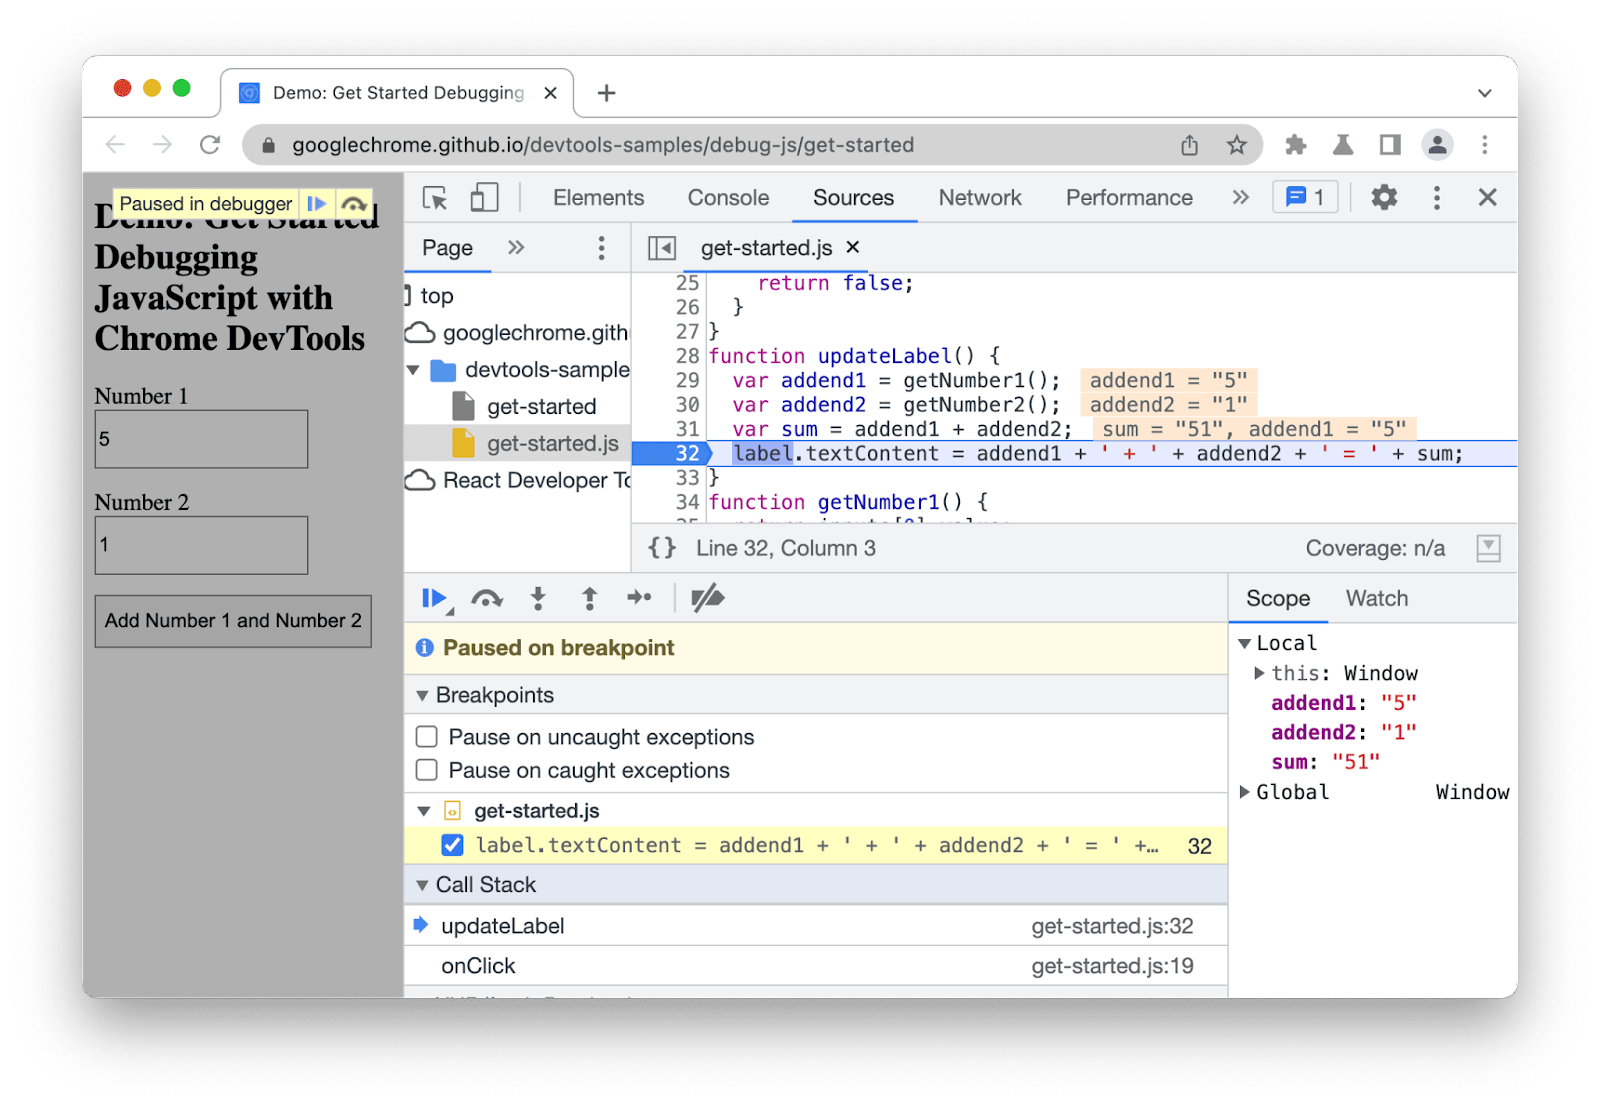
Developer Tools include a built-in JavaScript debugger that allows you to set breakpoints, step through code line by line, and inspect the state of variables at different points in the execution.
This is incredibly useful for diagnosing complex JavaScript issues, understanding how code behaves under different conditions, and fixing bugs.
Just open your front end application and place debugger; on the line when you want the procedure to start.
Open inspect element in Chrome, and refresh the page.
Step by step, you can journey through your code, peering into the inner workings of data and uncovering the root of the issue, powered by Chrome!
.png)
Version Control debugging - Basically mastering bugs
Many IDEs offer integration with version control systems like Git, allowing you to seamlessly debug code from different branches or versions of your project.
You can use git blame, compare with branches, review commits, switch to different branches and many more functionalities to identify why and when some bug appeared.
This can be useful for isolating and debugging issues introduced by recent changes to your codebase.
Mighty duo, Google Search and Stack Overflow
When in doubt, turn to the trusty duo of Google Search and Stack Overflow.
Google may help you in many aspects.
Sometimes the bug you’re facing may come from an included library and it's a known bug, so don’t waste time and be sure of this too.
ChatGpt - As for everything else
Chatgpt can be useful when you see an error message that you're not sure what it means. Make sure the message doesn't contain any client information or code.
It can give you directions and ideas about what has gone wrong and recommend actions and solutions.
But be careful of the relevance of the information and before performing any action be sure to google it first.
In a nutshell, leveling up your debugging game is like adding superpowers to your developer toolkit. It's not just about fixing bugs; it's about honing problem-solving skills and laying down a solid foundation for your future success in the software development industry.
For junior developers, mastering the art of debugging isn't just a game-changer, it's a sanity-saver! At least from my experience.
But by implementing and knowing all of this will eventually make you become more productive and efficient.
Keep in mind that debugging is more than just correcting mistakes, it's also about diving deep into the code, flexing those patience muscles (that as you already know, you need the most), and bouncing back stronger when things get tough.
If you are junior developer, you will surely sharpen your debugging skills through trial and error, and trust me, this will emerge you as coding ninja ready to tackle any challenge that comes your way.
So keep on practicing, keep on learning, and watch as your confidence soars to new heights, as you continue to refine your debugging techniques.
Now go and catch that new bug!